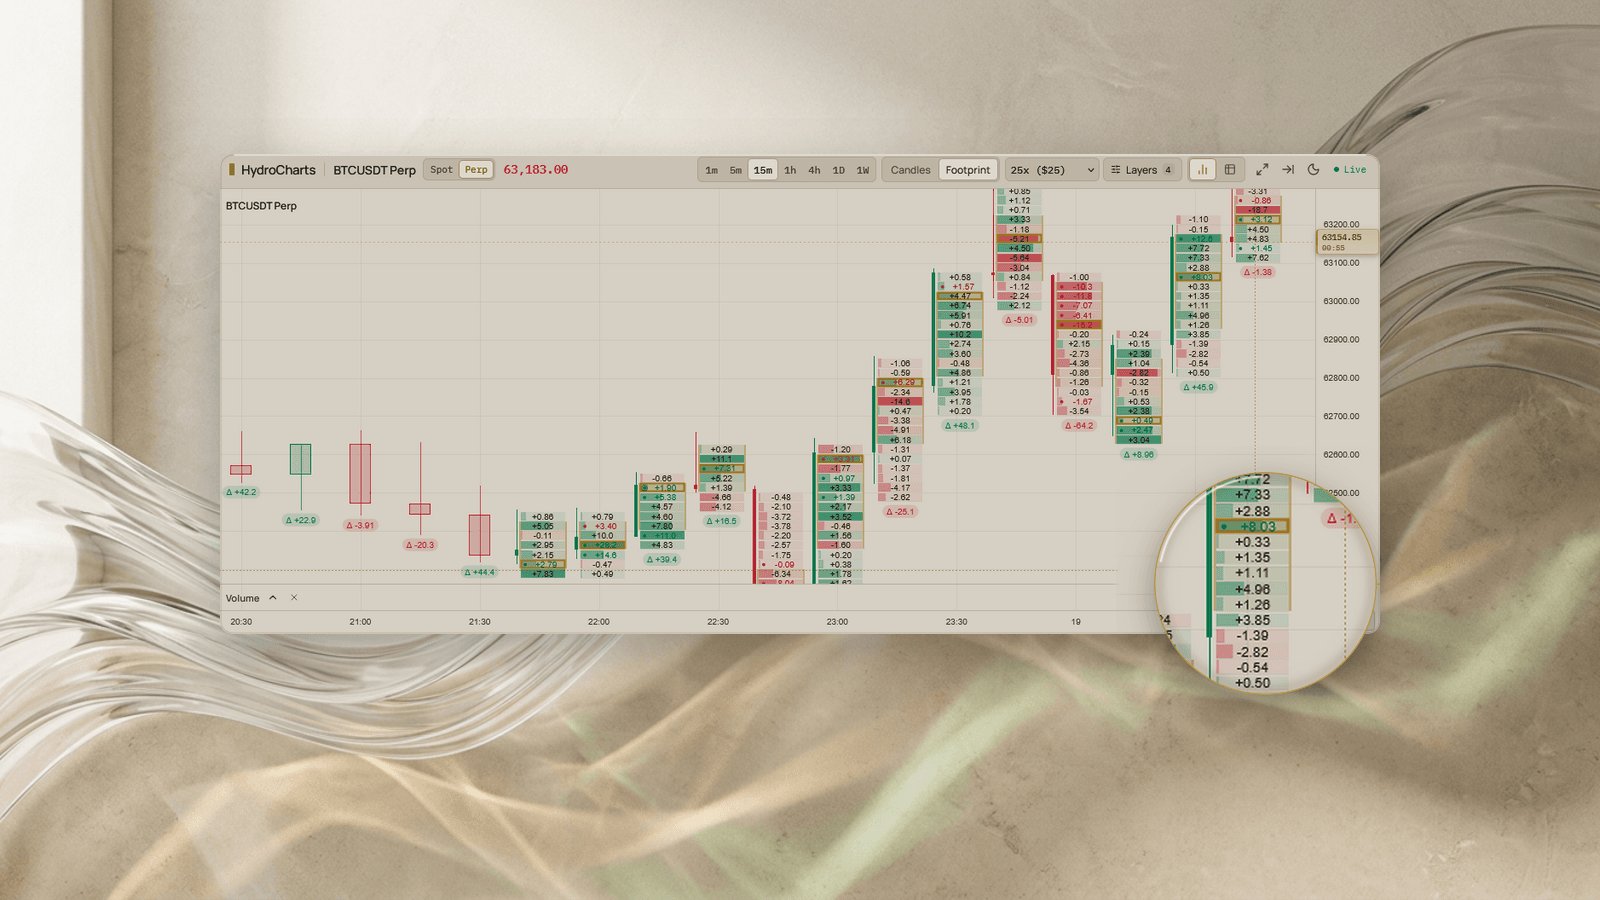
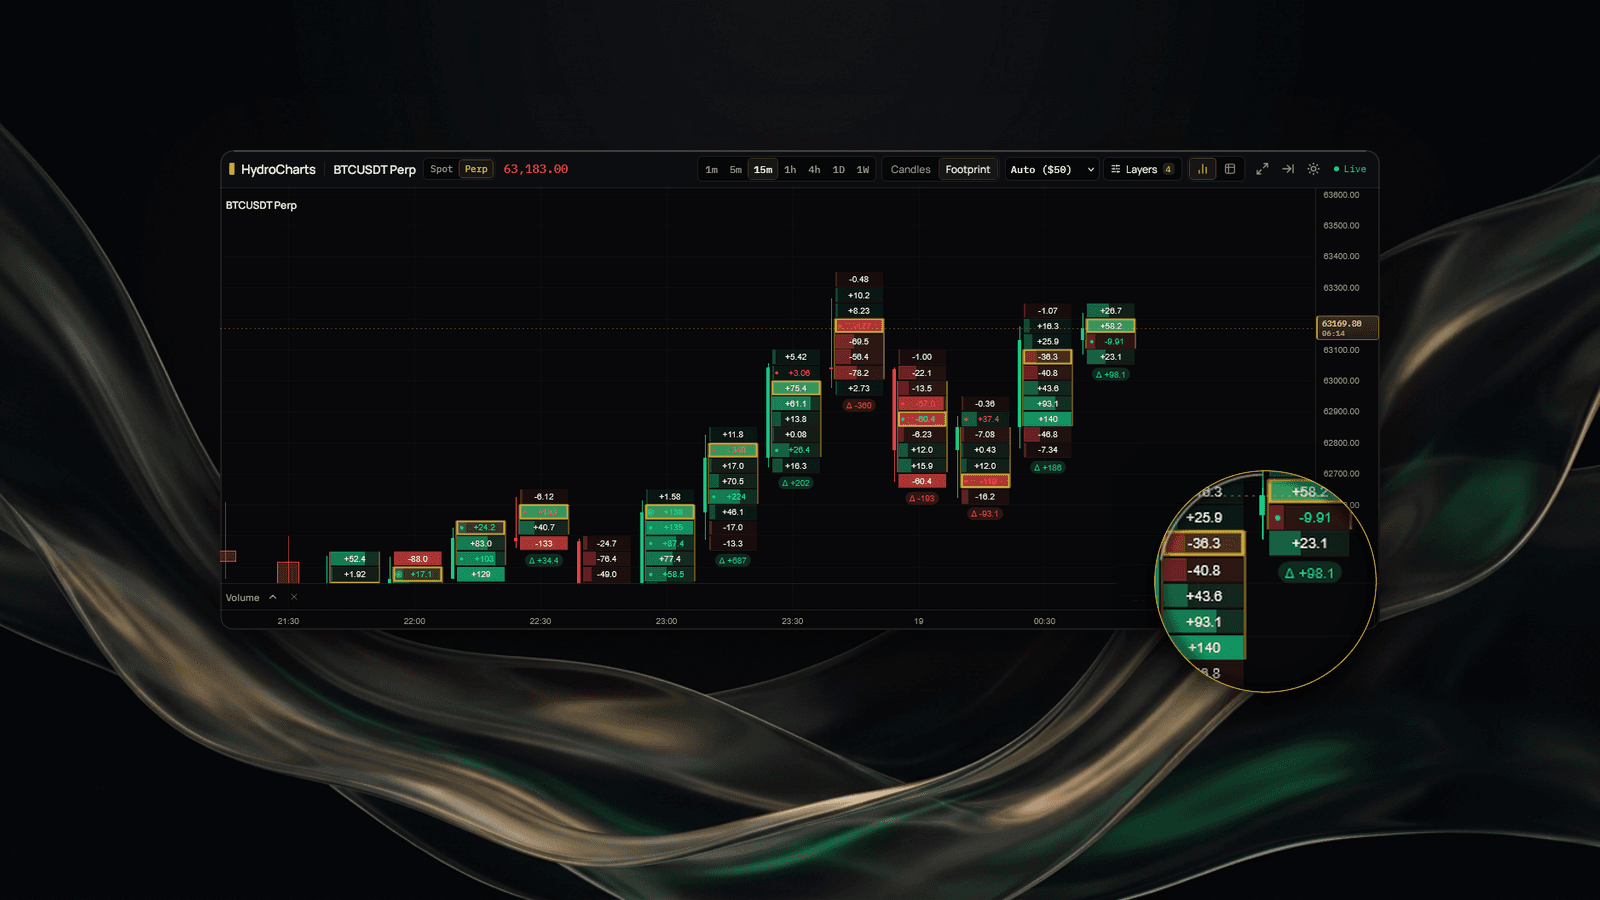
01. Bid × Ask Footprint Clusters & Delta
Track aggressive buyers lifting the ask against sellers hitting the bid at every price level. HydroCharts draws per-tick Bid × Ask cells, highlights diagonal buying and selling imbalances, marks each bar's Point of Control (POC), and computes real-time Net Delta on hardware-accelerated Canvas without DOM bloat.
Bid × Ask
Per-tick cluster ladder
POC + VA
Automated volume focus
Delta / CVD
Bar & cumulative flow
Imbalance
Diagonal ratio shading